Cross-company · Independent Outside-In Research
Why record backlog says less than it seems
Executive summary
Record backlog is usually read in one of two ways: as evidence of future revenue visibility, or as a sign that an industrial system is running into capacity constraints. Both readings are incomplete.
Across Powell Industries, Eaton Electrical Americas, Siemens Energy Grid Technologies and GE Vernova Electrification, backlog represents materially different economic objects. The differences are not limited to size. They include how far commitments extend into the future, how firm those commitments are, how quickly new orders replenish completed work, how quickly the system converts commitments into output, what economics are embedded in the order book, and when customers provide cash.
The result is a more useful interpretation: in long-cycle industry, backlog is an architecture of already-committed futures.
A large backlog does not, by itself, reveal capacity utilization, execution stress, economic quality or strategic flexibility. Public disclosures also do not provide a single reliable measure of what share of total future physical capacity has already been committed. This study does not attempt to manufacture such a denominator.
Section 1
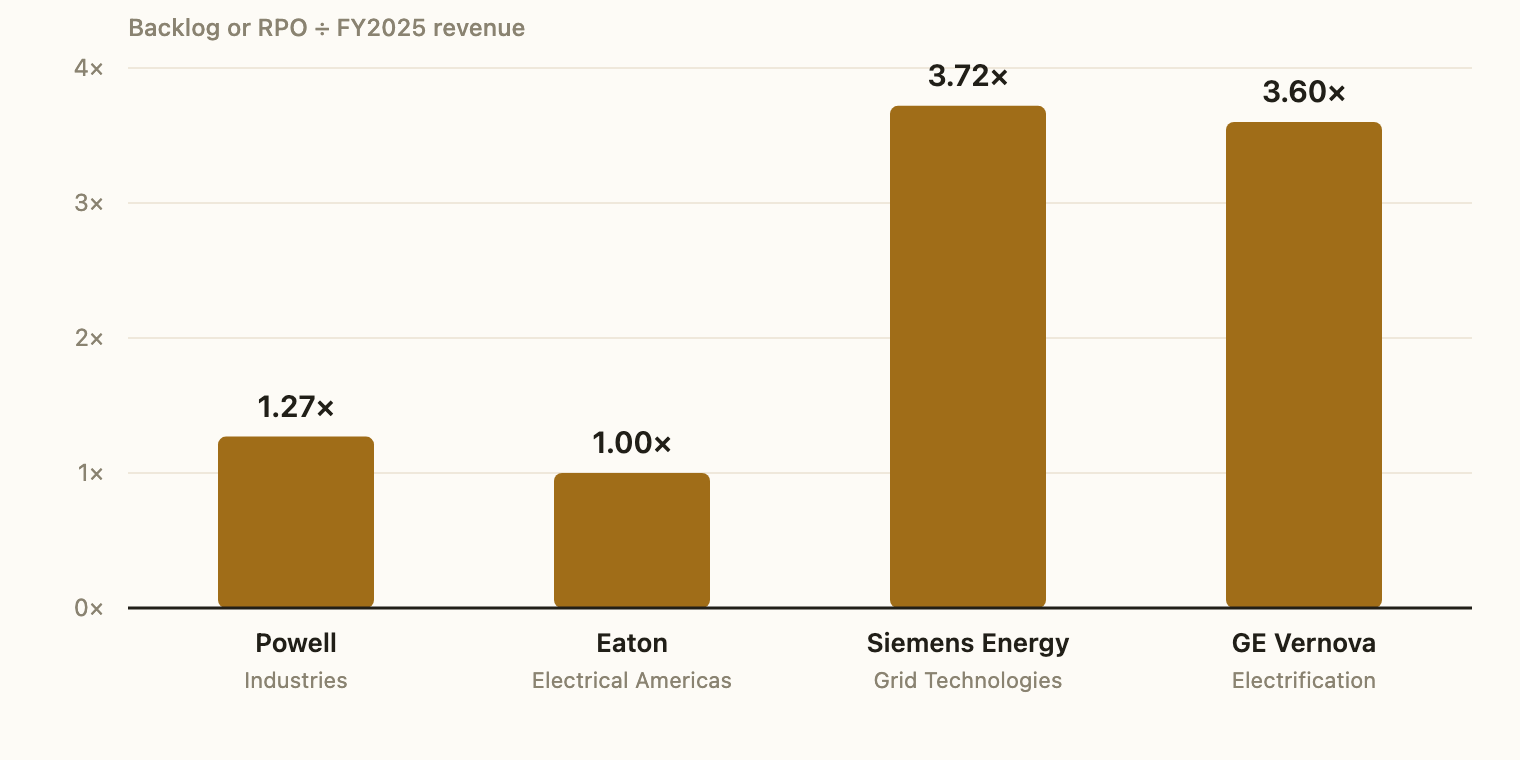
At the end of FY2025, backlog or remaining performance obligations amounted to the following multiples of annual revenue:
| Research unit | FY2025 revenue | Backlog / RPO | Commitment intensity |
|---|---|---|---|
| Powell Industries | $1.10bn | $1.40bn | 1.27× |
| Eaton Electrical Americas | $13.28bn | $13.25bn | 1.00× |
| Siemens Energy Grid Technologies | €11.3bn | €42bn | 3.72× |
| GE Vernova Electrification | $9.64bn | $34.67bn* | 3.60× |
* GE Vernova uses the frozen FY2025 historical reporting basis in this comparison. The revised 2026 reporting basis is treated separately below.
Powell reported FY2025 revenue of $1.104bn and backlog of $1.4bn. Eaton Electrical Americas reported $13.276bn of sales and $13.246bn of backlog. Siemens Energy disclosed €42bn of Grid Technologies backlog, split between €24bn of Solutions, €16bn of Products and €2bn of Digital & Service. (Powell SEC, Eaton 2025 Annual Report, Siemens Energy Grid Technologies presentation)
At first glance, Siemens Energy and GE Vernova appear to have several times more of their future “occupied” than Powell or Eaton.
That conclusion does not follow.
The ratio measures accumulated commitments relative to the current annual flow of revenue. It does not measure utilization, free capacity, execution stress or business quality.
Even the underlying term backlog is not fully standardized.
Powell defines backlog around remaining unsatisfied performance obligations and explicitly notes that orders can be cancelled or modified. Eaton includes orders to which customers are firmly committed and separately defines organic backlog and customer-order metrics. (Powell SEC, Eaton 2025 Annual Report)
The same nominal dollar of backlog can therefore differ in duration, legal firmness, payment structure and the production resources required to fulfil it.
Section 2
The clearest reason simple backlog ratios fail is time.
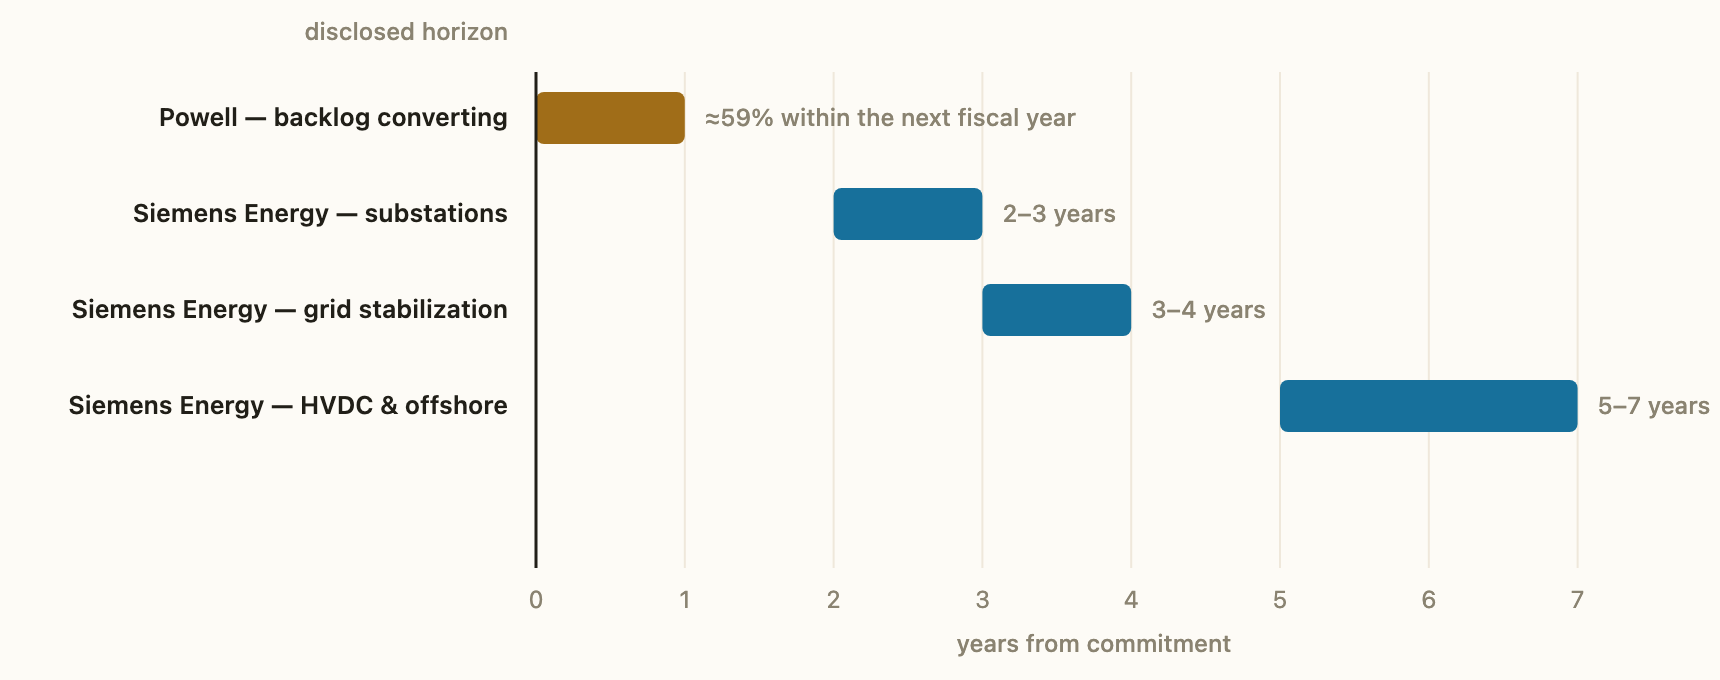
Powell ended FY2025 with $1.4bn of backlog. Approximately $824m was expected to be recognized as revenue during FY2026.
That means roughly 59% of the year-end backlog was expected to convert within the following fiscal year. (SEC)
Siemens Energy Grid Technologies presents a fundamentally different temporal structure.
Of its €42bn FY2025 order backlog, €24bn sat within Solutions. Within that Solutions backlog, Siemens Energy disclosed an average reach of:
(Siemens Energy Grid Technologies presentation)
This is not merely a larger backlog.
It is a different form of time.
A one-year conversion profile and a five-to-seven-year project horizon create different operational commitments even when expressed in the same currency.
Section 3
Powell provides a useful counterexample to the idea that a large backlog automatically means that an industrial system is trapped by its commitments.
The company entered FY2026 with $1.4bn of backlog, yet a substantial share was expected to move through the system within twelve months. By June 30, 2026, backlog had expanded to $2.4bn, with approximately $1.3bn expected to be recognized as revenue over the next twelve months. (SEC)
During the third fiscal quarter alone, Powell recorded $934m of bookings. (SEC)
The important observation is not simply that backlog increased.
The system was simultaneously executing existing work and accepting a much larger new stock of commitments.
Powell therefore looks less like a static wall of unfulfilled orders and more like a dynamic inventory of project work, whose economic meaning depends on the rate at which the company can process it.
This is also why backlog-to-revenue cannot serve as a substitute for capacity utilization.
Without a disclosed denominator for total available future physical capacity, that calculation cannot be made reliably.
Section 4
Eaton Electrical Americas displays a different architecture.
In FY2025, the segment generated $13.276bn in sales and $3.972bn in operating profit, while backlog reached $13.246bn. Organic backlog growth was 19%, organic customer-order growth was 16%, and reported book-to-bill was 1.2. (Eaton)
Rather than a deeply pre-booked multi-year project system, Eaton resembles a continuously replenished industrial queue.
Execution rises, but new commitments continue to occupy the capacity being created.
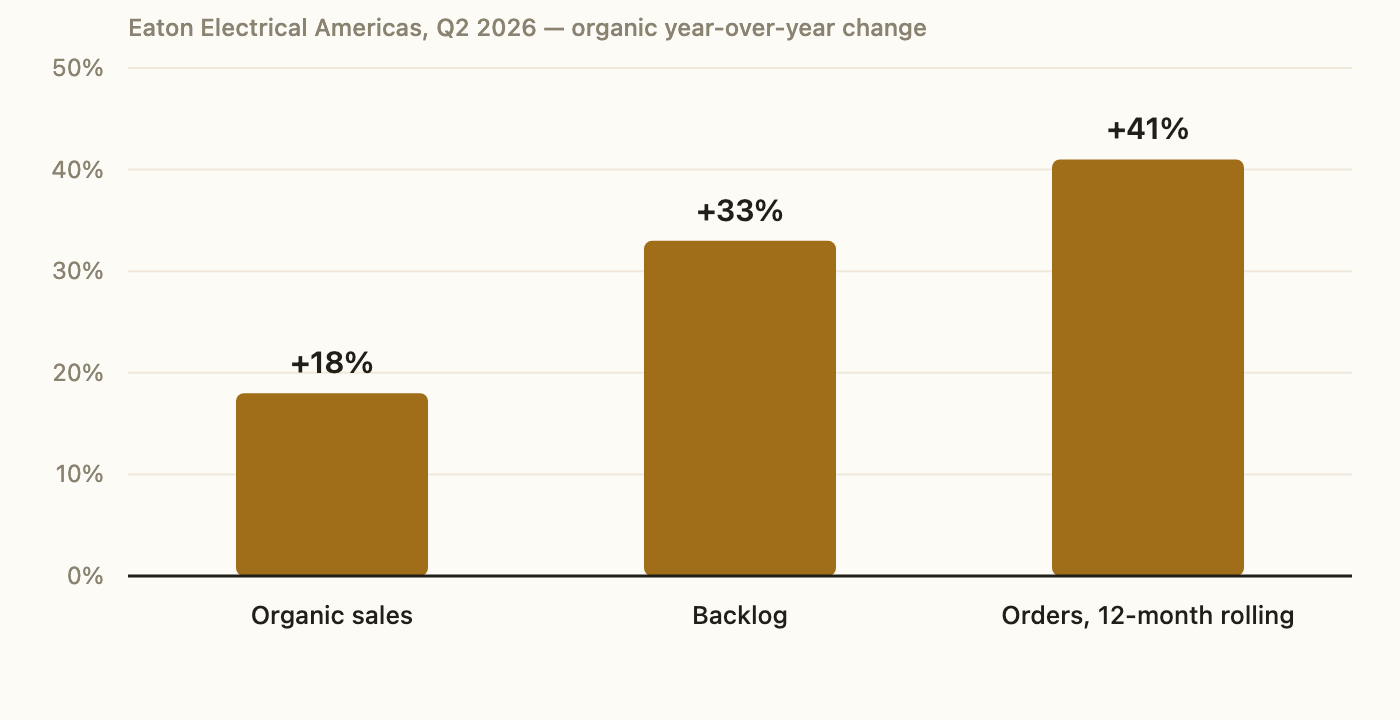
The pattern remained visible in Q2 2026. Electrical Americas reported record sales of $4.0bn, up 18% organically. Its twelve-month rolling average of orders was up 41% organically, while backlog was 33% above June 2025. Operating margin was 27.5%. (Eaton)
This directly challenges the assumption that a growing backlog must indicate deteriorating execution.
Sales can rise.
Margins can remain strong.
New orders can accelerate.
And backlog can continue to grow at the same time.
The more useful question becomes:
Section 5
Grid Technologies is the clearest example in the group of genuinely multi-year commitment depth.
Its FY2025 order backlog stood at €42bn. €24bn belonged to Solutions, with large portions extending several years into the future.
This allows a narrower and more defensible statement than “the factories are X% full.”
A substantial body of contracted work has already been allocated to future periods of execution.
That does not tell us the exact utilization of every plant, engineering team or supplier.
It does tell us that the system's future workload is materially pre-committed across multiple years.
Capacity expansion does not automatically release that future.
By March 31, 2026, Grid Technologies backlog had risen to €49bn. In Q2 FY2026, orders were €7.0bn against €3.1bn of revenue and book-to-bill reached 2.3. (Siemens Energy Q2 FY2026 presentation)
This produces a distinct dynamic:
execution rises → capacity is expanded → new commitments continue arriving fast enough to occupy the additional future.
The backlog is therefore not simply a measure of demand.
It is part of the system's temporal architecture.
Section 6
GE Vernova Electrification presents another form of committed future.
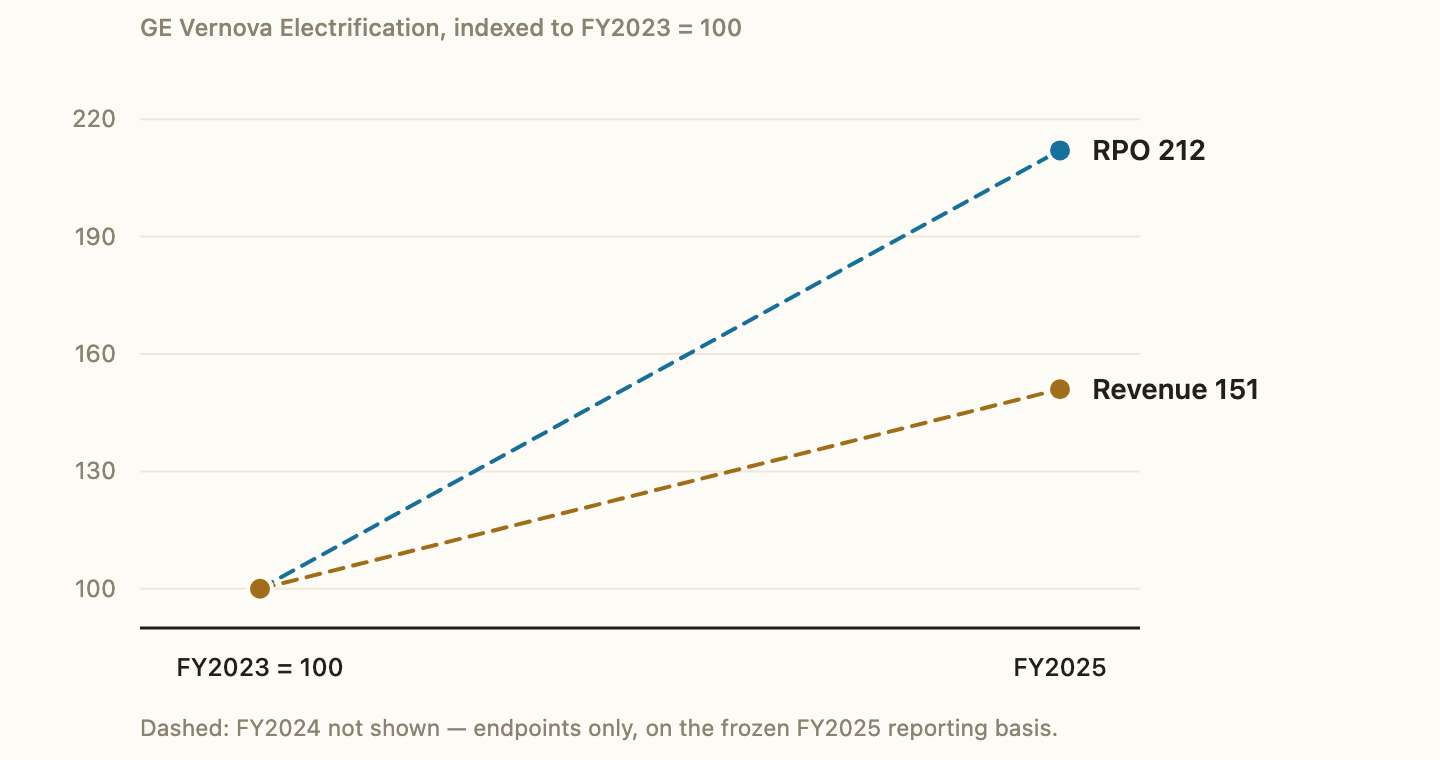
On the FY2025 reporting basis used for the historical portion of this study, segment revenue increased from $6.378bn in 2023 to $9.642bn in 2025, while total RPO increased from $16.342bn to $34.667bn. (GE Vernova FY2025 SEC filing)
Revenue therefore increased by roughly 51% over the period, while RPO more than doubled.
The composition matters as well. The historical FY2025 disclosure showed the majority of Electrification RPO associated with equipment rather than services. (GE Vernova FY2025 SEC filing) That means the growth in committed future work cannot be understood simply as an accumulation of long-duration service contracts.
The result is a compounding commitment architecture: execution grows quickly, but the stock of future work grows faster.
This boundary matters.
GE Vernova's 2026 filing presents December 31, 2025 Electrification RPO on a revised basis of $34.242bn, including $30.508bn of equipment and $3.734bn of services. By June 30, 2026, reported RPO had increased to $44.563bn, but the company explicitly identified the Prolec GE acquisition as one of the principal drivers of that increase. (SEC)
For that reason, this study does not splice the 2026 numbers into the FY2023–FY2025 historical series as if the reporting perimeter had remained unchanged.
Section 7
Several intuitive interpretations fail across these four systems.
Powell can process a large stock of work rapidly. Eaton can expand sales while orders and backlog continue growing.
Commitment intensity describes the relationship between accumulated work and current execution flow.
It does not reveal the percentage of physical capacity already occupied.
High commitments can coexist with strong execution and strong margins.
Eaton Electrical Americas, for example, reported a 27.5% operating margin in Q2 2026 while its rolling order growth and backlog remained elevated. (Eaton)
The economic quality of the order book therefore matters independently from its size.
If replenishment is faster than execution, newly created capacity can be committed almost as quickly as it comes online.
Siemens Energy's Q2 FY2026 disclosure shows this directly at the system level: revenue increased, yet backlog remained at €49bn and book-to-bill stood at 2.3.
That concept is too broad.
A commitment can reduce one form of freedom while increasing another.
Section 8
A long-cycle contract does bind future decisions.
If an industrial company commits to deliver a transformer, HVDC system, switchgear package or engineered electrical system years into the future, some future production time, engineering effort and supply-chain capacity already have an intended use.
That reduces scheduling freedom.
But the same contract can increase other forms of freedom.
Customer commitments may improve workload visibility.
Strong demand may allow the company to become more selective about pricing and contractual terms.
And in some project structures, customers provide cash before final delivery.
This is visible in GE Vernova's contract liabilities and deferred income. At June 30, 2026, Electrification reported $9.124bn in this category. The 2026 movement is not a clean organic series because the period also includes acquisition effects, which is why it is not used here as a comparable growth metric. (SEC)
The broader point is narrower than saying “backlog funds capacity.”
Some forms of committed work can simultaneously consume future execution capacity and provide financing before final delivery.
A contract can therefore:
These effects need not move in the same direction.
Section 9
The comparison produces a framework with seven separate dimensions.
It is not a score, ranking or synthetic index.
How much unfulfilled work has already been accepted relative to the system's current execution flow?
Backlog-to-revenue is useful here — and only here.
How far into future periods do the obligations extend?
Powell's relatively near-term conversion profile and Siemens Energy's multi-year Solutions portfolio are economically different forms of commitment.
How firm is the obligation?
Can the customer cancel, delay or change it? Under what economic consequences?
How quickly do new commitments replace the work being completed?
A system can increase throughput and still accumulate backlog if replenishment remains faster.
How quickly can accepted work become delivered output and recognized revenue?
This rate is not fixed. Powell illustrates how materially it can change over time.
What pricing, margin, escalation terms, fixed-price exposure and execution risks are already embedded inside the order book?
Two equally sized backlogs can contain very different future economics.
When does cash arrive relative to performance?
A project funded partly through advances or milestone payments creates a different capital burden from one financed predominantly by the supplier until delivery.
Together, these dimensions provide a more informative description of industrial commitments than backlog size alone.
Section 10
The four systems cannot be placed honestly on a single linear scale.
Powell Industries represents a relatively rapid-conversion project architecture. A significant portion of backlog can move through revenue within a comparatively short period, while the stock of future work can still replenish sharply.
Eaton Electrical Americas represents a rolling industrial commitment architecture. Execution expands, but demand continues to occupy the capacity being created.
Siemens Energy Grid Technologies represents a deep-duration architecture. Material portions of already-accepted work extend several years into future execution periods.
GE Vernova Electrification represents a compounding architecture. Execution expands rapidly, yet commitments have accumulated even faster on the frozen FY2023–FY2025 historical basis.
These descriptions are not rankings.
None implies that one system is inherently superior, safer or more efficient.
They describe different ways in which future work has already been allocated.
Section 11
The most important methodological boundary of this study is also one of its principal findings:
None of the four research units discloses a universal denominator that would allow an analyst to calculate a comparable percentage of “occupied” or “free” physical capacity.
Accordingly, this study does not estimate one.
Public disclosures also do not provide a fully comparable basis for calculating:
These gaps should not be replaced with artificial precision.
The absence of a denominator is itself evidence.
Conclusion
In long-cycle industry, a company is not merely selling equipment when it accepts an order.
It is allocating part of its future system.
It is allocating time.
Factory resources.
Engineering capacity.
Supply-chain commitments.
Capital.
Future cash flows.
And part of its ability to make the next decision.
But these resources do not move in one direction.
A contract can reduce scheduling flexibility while improving financial visibility.
It can occupy a future production slot while providing cash before delivery.
It can increase execution exposure while improving commercial selectivity.
For that reason, the strategically useful question is not:
How large is the backlog?
It is:
That is the point at which backlog stops being a line in financial disclosure and becomes an architecture of the industrial system.
Methodology
This study compares four research units rather than four consolidated legal entities:
Powell Industries; Eaton Electrical Americas; Siemens Energy Grid Technologies; GE Vernova Electrification.
The core historical layer uses FY2023–FY2025 disclosures. Fiscal years are preserved as reported by each company rather than artificially converted into one calendar period. Public information available through September 19, 2026 is used only as a persistence layer to test whether the observed structures continued; it is not retroactively merged into the historical baseline.
No common definition of backlog is imposed where company definitions differ.
No synthetic capacity-utilization measure is constructed.
No ranking is produced.
The study uses four evidence classes:
FACT — directly disclosed by a primary source.
DERIVED — calculated from disclosed values; the calculation does not change the evidentiary status of the underlying data.
INFERENCE — an interpretation supported by multiple observations but not directly stated by the company.
UNKNOWN — the required public evidence is absent or insufficient.
A derived metric or inference is never treated as a disclosed fact.
Boundaries
The analysis is constrained by differences in backlog definitions, segment boundaries, financial-year timing, revenue recognition, contract cancellation provisions and disclosure depth.
The most important limitation is physical capacity. Companies disclose factory additions, investment programs, production expansion and, in some cases, product-specific capacity data. They do not disclose one comparable system-wide denominator for available future capacity.
The study therefore does not claim to know what percentage of each company's future physical system has already been reserved.
GE Vernova requires an additional boundary rule. FY2023–FY2025 remain on the historical FY2025 reporting basis used in the research. The 2026 reporting layer is treated separately because the segment reporting boundary changed and Prolec GE entered the system. GE Vernova's June 2026 filing shows a revised December 31, 2025 Electrification RPO basis of $34.242bn and explicitly identifies Prolec GE among the drivers of subsequent backlog growth. (SEC)
Evidence
Primary sources only — SEC filings, company IR releases and official annual reports. Numbers used above trace to the entries below.
Powell Industries — Form 10-K, fiscal year ended September 30, 2025.
FY2025 revenue, backlog, expected FY2026 backlog conversion and backlog definition. SEC filing
Powell Industries — Form 10-Q, quarter ended June 30, 2026.
$2.4bn backlog, approximately $1.3bn expected within twelve months and Q3 bookings. SEC filing
Eaton — 2025 Annual Report.
Electrical Americas sales, profit, backlog, organic order growth and book-to-bill definitions. Eaton 2025 Annual Report
Eaton — Q2 2026 results.
Electrical Americas sales growth, order growth, backlog growth and operating margin. Eaton Q2 2026 results
Siemens Energy — Grid Technologies Capital Market Day, November 2025.
€42bn backlog, €24bn Solutions backlog and disclosed execution horizons. Siemens Energy Grid Technologies presentation
Siemens Energy — Q2 FY2026 analyst presentation.
€49bn Grid Technologies backlog and Q2 book-to-bill of 2.3. Siemens Energy Q2 FY2026 presentation
GE Vernova — Form 10-K, fiscal year ended December 31, 2025.
Historical FY2023–FY2025 Electrification basis used in the frozen research layer. SEC filing directory
GE Vernova — Form 10-Q, quarter ended June 30, 2026.
Revised December 2025 reporting basis, June 2026 RPO, Prolec GE effect and contract liabilities. SEC filing
Author
Founder & Research Lead, aiclavis
LinkedIn